Two years ago I received seed funding from the WSU Energy Systems Innovation Center (ESIC) to investigate the potential for large scale hydrogen liquefaction in the Pacific Northwest. Since then I’ve had numerous conversations with diverse stakeholders including existing liquid hydrogen producers, program managers in the Department of Energy, Bonneville Power Administration, wind farm operators, chlor-alkali plant operators, bio-mass refiners, bio-fuel producers, and regional fuel cell companies. After two years of considering all of the diverse stakeholders for a system of this size and complexity, an awesome concept for our region has finally emerged. I’ll present this in the following parts: 1) existing North America hydrogen liquefiers, 2) interfacing with the local electric grid, and 3) potential for clean energy export. All of this culminates in a vision for the Pacific Northwest to be a net exporter of clean fuels with the potential to stream billions into our region’s economy.
- Existing North American Hydrogen Liquefiers
Although 80-90% of small merchant hydrogen in the US is shipped via cryogenic liquid tanker truck, the price of this liquid varies considerably based on distance to the liquefier. The cost breakdown for liquid is roughly ~$5/kg to produce the liquid, then another $3-15/kg for delivery depending on distance. Keep in mind a kg of hydrogen is roughly equivalent to a gallon of gasoline for energy, although fuel cells are able to extract 2-3x more energy than gasoline engines. The reason we use liquid tanker trucks is mass/deliver. Gaseous tube trailers pressurized as high as 350 bar (5000 psi) only hold ~350 kg of hydrogen, that’s about one tenth (one order of magnitude less) than what a liquid tanker truck will deliver (~3000 kg/deliver).
Below is a map of the North America hydrogen liquefiers. I’ve added the circle to show the gaping hole in the center of the country. To make matters worse, only the Niagara and Mississippi liquefiers can be considered “green” because they collect hydrogen from a green source (landfills) and utilize sustainable/renewable electricity for liquefaction. The smallest of these plants is the San Francisco Bay area at ~6 tonne/day (1 tonne = 1000 kg). Most of the plants are ~30 tonne/day, are operating at ~33% of theoretical efficiency limit, and can ramp less than ~30% per day. All of the plants were built from NASA and DOD funds during the cold war/space race days as the capital cost for one of these plants is huge (~$1-2 million/tonne capacity). Although the gas companies (Praxair, Air-Liquide, Air Products, Linde, etc.) are always looking for opportunities to site new liquefiers, no huge free sources of hydrogen gas (usually a huge chlor-alkali bleach plant, we have small-medium scale plants) are in our region to justify installation of a new liquefier.
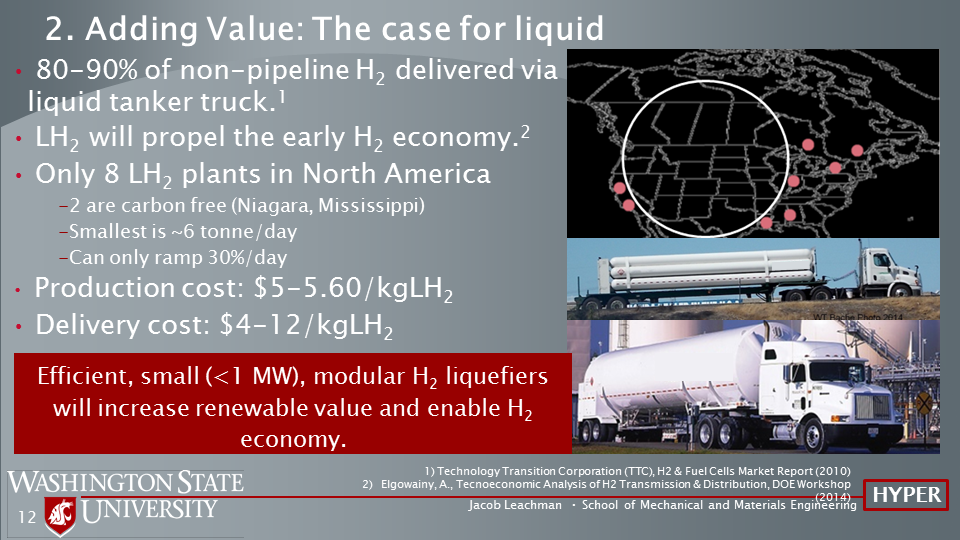
The bottom line is if you want liquid hydrogen here in the Northwest, which is needed for a number of industries, you’ll need a minimum of a 3000 gallon tank and pay in the range of $12-20/kg. This is the number one reason hydrogen fuel cell fork-lifts and hydrogen fuel-cell cars are not in our region yet.
2. Interfacing with the Pacific Northwest Electric Grid
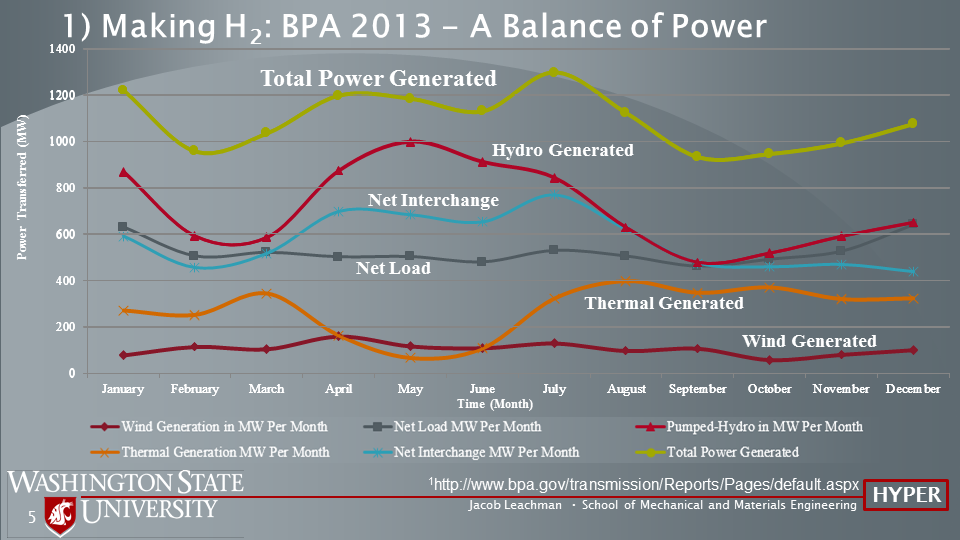
The Pacific Northwest has the lowest carbon energy grid in the US and potentially the world. This is due to a large infrastructure of hydro-electric dams on the Columbia and lower Snake Rivers combined with wind and nuclear energy. A breakdown of our region’s energy supply, by type, throughout a typical year (2013) is shown in the figure below. As you can see we generate just over 1 GW of power, nearly all of it is hydro-electric with just enough thermal to counterbalance the spring run-off. The amount of wind is small, but as we’ll see it’s significant. We end up using just under half of our power with the rest going down the Western Interconnection to California.
Even better news is that we have significant potential to install MUCH MORE clean wind power. Here’s a map of Washington’s wind resource estimates:
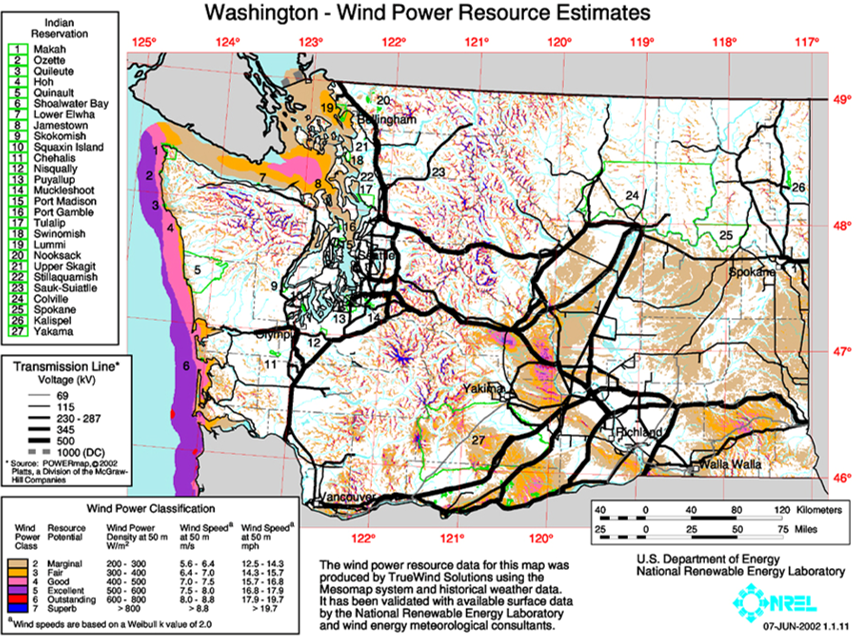
While there is huge potential for off-shore wind, the area we’ll focus on for immediate needs is the bottom center near the Columbia Gorge where the Cascade mountains create a large funnel effect. If we zoom in on this region to just look at the permitted and installed wind farms we see that roughly half of the permitted farms have not been built yet. This is also expressed by the figure on the right showing the overall installed wind capacity for our region and that it hit a limit in 2012. 
It should be noted that our installed capacity value is huge compared to the overall wind power on the grid in the earlier graph. This discrepancy, and limit we reached is called the Curtailment limit. Curtailment is when you must waste energy, by either allowing the wind-mills to free spin without generating energy or dumping the energy into a heater buried in the ground, because the grid doesn’t have capacity to handle the additional energy. The Bonneville Power Administration (BPA) is the energy authority for our region that is charged with maintaining the power of our energy grid. Here is a graph of BPA’s balancing reserves deployed, which is energy added to the grid (INC) or removed from the grid (DEC) to keep it balanced.

Notice that we can add or remove roughly 0.8-1 GW from the grid at any given time. Over the last week from this post we exceeded curtailment limits twice. These can create situations where BPA will actually have to pay people to shut down equipment or to start up equipment to take power off of the grid. The mid-Columbia spot market price for electricity was a meager 1.2 cents for a KW-hr last week and can go negative.
BPA is trying to combat the infrequency of wind supply by creating incentives for wind-farm operators to self-regulate power supply. I talked with the operators of one wind farm that lamented their 300 MW installed capacity was only valued at ~80 MW due to the infrequency of the wind power. Although vanadium-flow batteries are a much, much needed technology perfectly suited to these needs, the largest (which is on WSU’s campus) is just 1 MW, and the capacity is limited. Having a hybrid storage system, much like a car, that uses a battery for the quick daily cycling backed up by a hydrogen/fuel-cell system for the long-hall events is likely the optimal. Several fuel cells/electrolyzers are suitable for this use. Proton Exchange Membrane Electrolyzers (PEME) like those from ITM or hydrogenics, operate near 60% efficiency to produce hydrogen from water. Another approach is the up and coming battolyser that has both electricity storage as a battery and generates hydrogen when full. These units can be made at the many MW scale, electrolyze water to produce large quantities of hydrogen, and then reversed to convert natural gas into electricity when the grid needs power. The PEME units are typically $1000-2000 per kW capacity and are on par with the Vanadium flow battery technology.
The take-away is that we could substantially and quickly increase (double?) our region’s wind capacity while increasing value of existing wind farms. We can immediately shave off the peaks of wind power via electrolyzers and then use these same systems to add power to the grid from natural gas or reserve hydrogen when needed. 100 MW of wind capacity could produce 65,000 kgH2/day alone. The old aluminum smelter (also a brown site) near the John Day dam is in the middle of the Columbia Gorge wind region shown above and is close to a major natural gas line, water is obviously not a problem. The regions two largest landfills are in the bordering hills with huge hydrogen production potential. A pipeline could run all of this hydrogen down the Columbia to Longview. Considering the value of liquid hydrogen above, converting the wind power into liquid hydrogen is roughly a 37.5x value increase from an energy standpoint and likely the greatest potential to increase the value of our region’s energy.

3. Potential for Clean Fuel Export
Significant potential exists for chemical feedstock production that require large amounts of hydrogen. The two largest chemical synthesis processes currently using hydrogen in the world include ammonia fertilizer and methanol. Our region has significant potential for both. The inland-empire utilizes substantial amounts of ammonia fertilizer for our wheat production.
The NARA project is WSU’s single largest research grant to convert woody-biomass into jet fuel. A key limiter in the conversion of woody-biomass into jet fuel is the supply of hydrogen molecule to balance the high carbon-content of the biomass. Just down stream of the John Day site above is Longview, Washington. Longview is home to a large lumber industry and waste wood-chip facility. Longview has a deepwater port that could produce and export huge quantities of methanol from waste woody-biomass. Moreover, the Port of Longview recently purchased an additional 280 acre site and just ceased discussions regarding a proposed petroleum refinery. Longview is also home to a chlor-alkali facility that currently vents significant quantities of hydrogen due to a lack of feasible storage options.
While my estimates here are preliminary, it’s entirely feasible that the Longview Port could easily be home to at least a 100 tonne/day hydrogen liquefaction facility, the largest in North America. This number could increase to 250 tonne/day. This would allow our region to continue to install wind power, synergize with a major methanol production plant, and synergize with a large liquefied natural gas facility for export that Congress just opened the door for with the Clean Energy Bill passage.
Where will we put all of this hydrogen? Kawasaki Heavy is currently building the world’s first liquid hydrogen tanker. With a 2,500 m³ capacity, the tanker cargo is worth $6 Million per load, fills in less than 6 hours which is the equivalent to a 1 GW energy transfer, and would take 2 days to generate enough hydrogen to fill at the 100 tonne/day capacity. That’s nearly 35,000 hydrogen fuel-cell car charges at 5 kg each. That’s a substantial portion of our region’s cars if they are converted to Hybrid Fuel-Cell Electric Vehicles that primarily utilize electricity from the grid for daily commute with the hydrogen as back up.

In Summary
The Pacific Northwest is disadvantaged due to proximity to existing hydrogen liquefiers. Adding a major hydrogen liquefier to our region removes significant strain on our electricity grid and allows for substantial increases in our installed wind capacity in a synergistic geographical region. This hydrogen production capacity solves existing needs for hydrogen with ammonia production and methanol production. The potential for co-location of an LNG terminal in Longview with LH2 and methanol would multiply benefits to our region. We would immediately have the potential to install hydrogen refueling stations and enable hydrogen economies in the Pacific rim through bulk exports.
With the recent approval of the Energy Bill incentivising coastal LNG terminals, now is the time to seize this opportunity for the benefit of our region and begin to lay the groundwork for a major hydrogen liquefier.